The image
You have 25 seconds to prepare and 40 seconds to speak.
Sample answer (54 words, about 35 seconds)
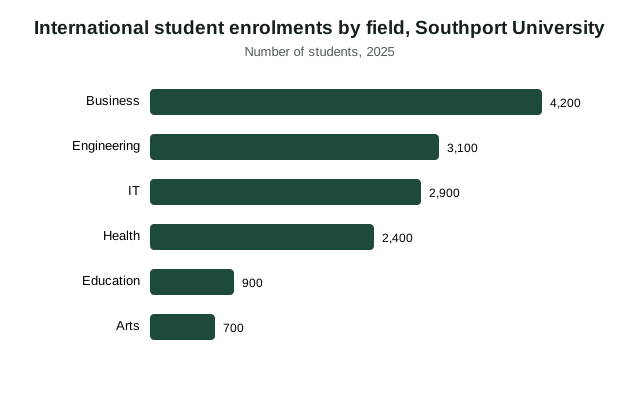
The chart shows international student enrolments by field at Southport University in 2025. Business was the most popular field, with 4,200 students, followed by engineering with 3,100 and IT with 2,900. Health attracted 2,400 students, while education and arts were much smaller, at 900 and 700. Overall, business and technical fields dominated international enrolments.
The structure behind it
- Introduce: "The bar chart shows/compares…" (what, where, when)
- Main feature: the biggest, highest or most important thing
- Two details with numbers: one comparison, one change or contrast
- Conclusion: "Overall, …"
Keep a steady pace and don't stop for more than 3 seconds; a long pause can end your recording. Fluency and pronunciation count for more than describing every detail.
Practise it
Try this image yourself on the Describe Image practice page, which records your answer on your device and shows your start time and pauses. More: all Describe Image examples.
Frequently asked questions
How do I describe a bar chart in PTE?
Introduce what the bar chart shows, describe two or three key features with numbers or comparisons, then finish with a short conclusion. Keep speaking smoothly.
How long do I have for PTE Describe Image?
25 seconds to prepare and 40 seconds to speak.
How is PTE Describe Image scored?
On content, oral fluency and pronunciation. Fluency and clear pronunciation matter as much as the details.